
In today’s dynamic digital landscape, tracking the right metrics is essential for digital marketing success. Understanding which key performance indicators (KPIs) to monitor allows marketers to measure the effectiveness of their campaigns, identify areas for improvement, and ultimately achieve their business objectives. This article will explore the top metrics to track in digital marketing, providing you with a comprehensive guide to optimizing your strategies and maximizing your return on investment (ROI). From website traffic and conversion rates to social media engagement and email marketing performance, we’ll cover the essential data points you need to monitor to stay ahead of the curve.
Whether you’re focused on search engine optimization (SEO), pay-per-click (PPC) advertising, social media marketing, or email marketing, this article will provide valuable insights into the specific metrics that matter most for each channel. By understanding these key metrics, you can make data-driven decisions, refine your digital marketing approach, and achieve measurable results. We’ll delve into the importance of each metric, how to track it effectively, and how to interpret the data to inform your digital marketing strategy. This knowledge will empower you to optimize your campaigns, allocate resources effectively, and drive meaningful growth for your business.
Why Metrics Matter in 2025
In the rapidly evolving digital landscape of 2025, understanding and leveraging metrics is more critical than ever. Data-driven decision making is no longer a luxury, but a necessity for survival. Metrics provide the crucial insights needed to navigate the complexities of online marketing and achieve desired outcomes. They offer a quantifiable measure of success, allowing businesses to track progress, identify areas for improvement, and ultimately, optimize their return on investment (ROI).
Without a clear understanding of key performance indicators (KPIs), businesses risk wasting valuable resources on ineffective strategies. Metrics illuminate which campaigns are resonating with target audiences, which channels are driving conversions, and which content is generating engagement. This granular level of information empowers marketers to make informed adjustments, refine their approach, and maximize their impact.
Furthermore, in a world increasingly dominated by artificial intelligence (AI) and machine learning, data plays an even more pivotal role. Metrics provide the fuel that powers these technologies, enabling algorithms to learn, adapt, and personalize the customer experience. By tracking and analyzing relevant data points, businesses can leverage AI and machine learning to automate processes, optimize campaigns, and drive greater efficiency.
Understanding Business Goals
Before diving into specific metrics, it’s crucial to understand your overarching business goals. These goals should drive your digital marketing strategy and inform the key performance indicators (KPIs) you choose to track. Without clearly defined objectives, measuring metrics becomes an exercise in futility.
Common business goals include increasing brand awareness, driving sales, generating leads, and improving customer retention. Each of these goals requires a different set of metrics to effectively measure progress.
For example, if your primary goal is to boost brand awareness, you might focus on metrics like reach, impressions, and social media engagement. If, however, your goal is to drive sales, you’ll likely prioritize metrics such as conversion rate, average order value, and customer lifetime value.
Defining your business goals upfront provides a framework for selecting the most relevant metrics and ensures your digital marketing efforts are aligned with overall business objectives.
Traffic vs Engagement Metrics
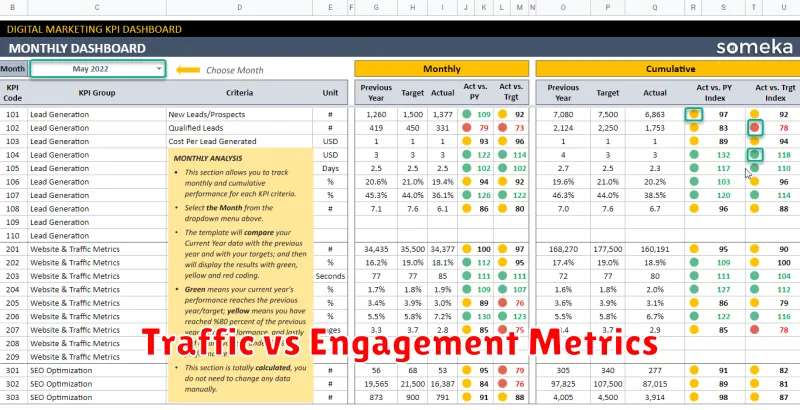
Understanding the difference between traffic and engagement metrics is crucial for effective digital marketing. Traffic metrics measure the volume of visitors to your online platforms. They provide insights into how many people are reaching your content. Key traffic metrics include unique visitors, page views, and sessions. High traffic numbers can indicate successful reach, but they don’t tell the whole story.
Engagement metrics, on the other hand, measure how visitors interact with your content. These metrics provide a deeper understanding of audience interest and involvement. Important engagement metrics include bounce rate, time on page, and conversion rate. Analyzing engagement reveals the quality of your traffic and how effectively your content resonates with your audience. A high volume of traffic with low engagement suggests a need to refine content strategy and targeting.
Conversion Rates Explained
Conversion rate is a crucial metric in digital marketing that measures the percentage of visitors to your website or platform who complete a desired action. This action could be anything from making a purchase, signing up for a newsletter, filling out a contact form, or downloading a resource.
Calculating the conversion rate is straightforward. Divide the number of conversions by the total number of visitors and multiply by 100. For example, if your website had 10,000 visitors and 200 of them made a purchase, your conversion rate would be 2%.
Understanding and optimizing your conversion rates is essential for maximizing the return on investment (ROI) of your marketing campaigns. A higher conversion rate signifies that your marketing efforts are effectively driving desired user behavior.
Various factors influence conversion rates, including website design, user experience, call-to-action clarity, and the overall value proposition offered. Analyzing these factors and implementing strategic improvements can lead to significant increases in conversions.
Customer Lifetime Value (CLTV)
Customer Lifetime Value (CLTV) represents the total revenue a business can reasonably expect from a single customer throughout their entire relationship. Understanding CLTV is crucial for making informed decisions about sales, marketing, product development, and customer support. By calculating and analyzing CLTV, businesses can optimize their spending and maximize profitability.
Calculating CLTV involves several factors, including average purchase value, purchase frequency, and customer lifespan. A simplified formula is: Average Purchase Value * Average Purchase Frequency * Average Customer Lifespan. More sophisticated models incorporate customer churn rate and discount rate for future cash flows.
Focusing on increasing CLTV can be more beneficial than solely pursuing new customer acquisition. Strategies for improving CLTV include personalized marketing campaigns, loyalty programs, and proactive customer service initiatives. By nurturing existing customer relationships, businesses can encourage repeat purchases and increase customer retention rates, ultimately driving higher CLTV.
Email Open and Click Rates
Email open and click rates are crucial metrics for evaluating the effectiveness of your email marketing campaigns. The open rate represents the percentage of recipients who opened your email. A high open rate suggests a compelling subject line and effective targeting. Conversely, a low open rate indicates potential issues with deliverability, subject line relevance, or audience segmentation.
The click rate, also known as the click-through rate (CTR), measures the percentage of recipients who clicked on a link within your email. This metric provides insight into the engagement level of your audience and the effectiveness of your email content in driving traffic to your website or landing page. A high click rate signifies relevant and engaging content, clear call-to-actions, and effective email design.
Tracking these metrics helps optimize future campaigns. For example, A/B testing subject lines can improve open rates. Experimenting with different call-to-action placements and wording can enhance click rates. Regularly monitoring these rates helps refine your email marketing strategy and achieve better results.
PPC Metrics You Should Monitor
Pay-per-click (PPC) advertising requires diligent monitoring to ensure optimal performance. Several key metrics provide valuable insights into campaign effectiveness. Click-through rate (CTR) measures the percentage of users who click on an ad after seeing it. A higher CTR indicates a more compelling ad and relevant targeting.
Conversion rate is crucial for understanding how effectively clicks translate into desired actions, such as purchases or sign-ups. Monitoring this metric helps optimize campaigns for conversions rather than just clicks. Cost per conversion reveals the financial efficiency of your campaigns, illustrating the average cost incurred for each conversion.
Impression share reflects the visibility of your ads compared to competitors. A low impression share may indicate the need to adjust bidding strategies or improve ad quality. Quality Score is Google’s assessment of your ads, keywords, and landing pages. A higher Quality Score can lead to lower costs and better ad positioning.
Tracking these core metrics allows for data-driven adjustments to improve PPC campaign performance and maximize return on investment.
SEO Rankings and Impressions
SEO rankings and impressions are crucial metrics for understanding your website’s visibility in search engine results pages (SERPs). Tracking these metrics helps gauge the effectiveness of your SEO strategies.
Ranking refers to the position your website holds for specific keywords in SERPs. A higher ranking, ideally on the first page, increases the likelihood of users clicking through to your site. Tracking keyword rankings over time helps identify the impact of SEO efforts and reveals areas for improvement.
Impressions represent the number of times your website appears in search results, regardless of whether users click. A high impression count suggests good visibility, but it’s essential to consider click-through rate (CTR) to ensure those impressions translate into actual website traffic. Analyzing impressions helps assess the reach of your content and identify potential for increased engagement.
Monitoring both rankings and impressions provides valuable insights into your website’s organic performance. These metrics allow you to adapt your SEO strategies, target relevant keywords effectively, and ultimately drive more organic traffic to your site.
Social Media KPIs
Tracking the right Key Performance Indicators (KPIs) is crucial for understanding the effectiveness of your social media marketing strategies. Engagement is a key metric, encompassing likes, comments, shares, and saves. It indicates audience interest and content resonance.
Reach measures how many unique users see your content. A larger reach expands brand awareness and potential customer base. Impressions, on the other hand, count the total number of times your content is displayed, regardless of unique views. High impressions can reinforce brand messaging.
Website traffic from social media is a valuable KPI for assessing how effectively your social channels are driving conversions. Track the number of clicks and the conversion rate from social media visitors to measure success.
Finally, follower growth, while a vanity metric on its own, can indicate increasing brand interest and a widening potential audience for your messages.
Setting Up Dashboards
Effectively tracking key metrics requires a well-organized dashboard. A good dashboard provides a centralized view of your most important data, allowing for quick analysis and informed decision-making. Choose a platform that suits your needs and budget. Options range from free tools like Google Data Studio to more robust paid platforms.
When setting up your dashboards, focus on clarity and actionability. Avoid clutter by only including metrics directly tied to your marketing objectives. Visualizations, such as charts and graphs, can greatly enhance understanding. Choose the visualization type that best represents the data being presented.
Customization is key. Tailor your dashboard to your specific needs and preferences. Most platforms allow you to arrange widgets, adjust date ranges, and set up automated reports. This allows you to monitor progress and quickly identify areas requiring attention. Regularly review and refine your dashboards to ensure they remain relevant and effective.