
In today’s dynamic market, leveraging data analytics is no longer a luxury but a necessity for successful marketing. Marketing analytics provide valuable insights into consumer behavior, campaign performance, and return on investment (ROI). By utilizing analytics tools and techniques, marketers can gain a deeper understanding of their target audience, optimize campaigns in real-time, and ultimately drive business growth. This article will explore the crucial role of data analysis in refining marketing campaigns and highlight key strategies for maximizing impact and achieving measurable results.
Using analytics to refine marketing campaigns empowers businesses to make data-driven decisions, moving away from guesswork and towards strategic precision. From analyzing website traffic and social media engagement to tracking conversion rates and customer lifetime value, the power of analytics provides a comprehensive view of campaign effectiveness. Learn how to transform raw data into actionable insights to improve your marketing strategies, enhance customer experiences, and achieve your marketing objectives.
Why Marketing Analytics Matters
In today’s complex and competitive market, marketing analytics plays a crucial role in driving successful campaigns. It empowers businesses to move beyond guesswork and make data-driven decisions that maximize return on investment (ROI).
By leveraging marketing analytics, organizations gain valuable insights into consumer behavior, preferences, and trends. This knowledge enables them to target the right audience with the right message at the right time, increasing engagement and conversion rates.
Furthermore, analytics provides a clear understanding of campaign performance. By tracking key metrics, businesses can identify what’s working and what’s not, allowing for real-time adjustments and optimization. This iterative approach ensures that campaigns remain effective and efficient.
Ultimately, marketing analytics empowers businesses to make informed decisions, optimize resource allocation, and achieve tangible results. It provides the necessary tools to measure success, justify marketing spend, and demonstrate the value of marketing efforts.
Defining Goals and Metrics
Before launching any marketing campaign, it’s crucial to define clear goals and identify the key metrics that will measure success. This provides a roadmap and allows for data-driven adjustments throughout the campaign lifecycle.
Start by outlining specific, measurable, achievable, relevant, and time-bound (SMART) goals. Examples include increasing brand awareness, driving website traffic, generating leads, or boosting sales. Each goal requires distinct metrics for accurate tracking.
For brand awareness campaigns, consider metrics like reach, impressions, and social media engagement. If the goal is to drive website traffic, track metrics such as unique visitors, page views, and bounce rate. Lead generation campaigns focus on metrics like form submissions, email sign-ups, and demo requests. Finally, for sales-focused campaigns, track metrics like conversion rate, average order value, and customer lifetime value.
Selecting the right metrics enables you to monitor campaign performance, identify areas for improvement, and demonstrate the return on investment (ROI) of your marketing efforts.
Tools to Track Campaign Performance
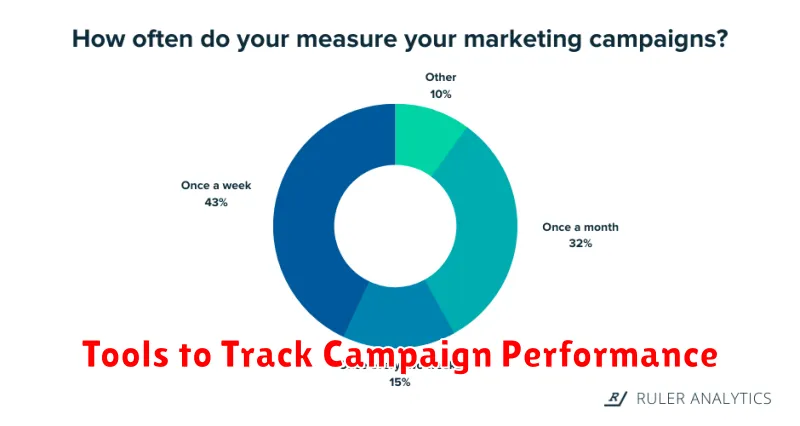
Tracking campaign performance is crucial for optimizing marketing efforts and maximizing ROI. Several tools provide the necessary data and insights to understand what’s working and what needs adjustment.
Website analytics platforms like Google Analytics are fundamental. They offer data on website traffic, user behavior, conversion rates, and attribution, helping pinpoint which campaigns drive valuable actions.
Social media analytics tools, often built into the platforms themselves (e.g., Facebook Insights, Twitter Analytics), provide metrics on engagement, reach, and audience demographics. These tools allow for real-time monitoring and analysis of social media campaign performance.
Email marketing platforms typically include analytics dashboards that track open rates, click-through rates, and conversions. This data helps assess the effectiveness of email campaigns and segment audiences for better targeting.
CRM (Customer Relationship Management) systems can integrate data from various sources, including website analytics, email marketing, and social media. This provides a holistic view of the customer journey and allows for a more comprehensive analysis of campaign impact on customer behavior and sales.
Marketing automation platforms often combine several of the above functionalities, streamlining campaign tracking and reporting. They can also automate certain tasks, such as sending personalized emails based on campaign performance.
Understanding User Behavior
User behavior analysis is crucial for refining marketing campaigns. It provides insights into how users interact with your marketing efforts, allowing for data-driven adjustments. By understanding user behavior, you can optimize your campaigns for better performance and ROI.
Key metrics for understanding user behavior include website traffic sources, bounce rates, time spent on page, and conversion rates. Analyzing these metrics can reveal which channels are most effective, which content resonates with your audience, and where users are dropping off in the conversion funnel.
For example, a high bounce rate on a landing page could indicate a disconnect between the ad copy and the landing page content. Analyzing user behavior helps identify these pain points and allows for targeted improvements. This might involve revising the landing page content, adjusting the ad targeting, or optimizing the user experience.
Through careful examination of user behavior data, marketers can identify patterns and trends that inform campaign adjustments. This iterative process of analyzing, adjusting, and re-analyzing is key to maximizing the effectiveness of your marketing campaigns.
Funnel Analysis and Drop-offs
Funnel analysis is a critical component of refining marketing campaigns. It provides a visual representation of the customer journey through various stages of the conversion process. By tracking user behavior at each step, from initial awareness to final purchase, you can pinpoint areas of friction.
Drop-offs, representing the percentage of users exiting the funnel at a particular stage, are key indicators of potential problems. A high drop-off rate suggests a need for optimization. For example, a large drop-off between adding an item to the cart and completing the purchase might indicate issues with the checkout process, such as complicated forms or a lack of clear payment options.
Analyzing these drop-off points allows marketers to identify specific areas for improvement within their campaigns. This could involve simplifying the checkout process, clarifying call-to-actions, or A/B testing different landing page designs to improve conversion rates.
Heatmaps and Scroll Tracking
Heatmaps and scroll tracking provide valuable visual insights into user behavior on your website. Heatmaps use color gradients to represent user interaction, highlighting areas that receive the most clicks, mouse movements, and attention. This allows you to quickly identify high-performing elements and areas of interest.
Scroll tracking reveals how far down the page users scroll, indicating the effectiveness of your content and layout. Understanding scroll depth helps determine if users are engaging with key information or abandoning the page prematurely. By analyzing scroll data, you can optimize content placement and improve user engagement.
Combining heatmaps and scroll tracking provides a comprehensive understanding of how users interact with your web pages. This information can be used to refine marketing campaigns by improving landing page design, optimizing call-to-actions, and enhancing the overall user experience. For example, if a heatmap shows low engagement with a particular call-to-action button, its placement or design might need to be reconsidered. Similarly, if scroll tracking reveals that a large portion of users aren’t reaching a key section of a landing page, the layout and content organization might need adjusting.
A/B Testing and Experimentation
A/B testing is a critical component of data-driven marketing. It involves comparing two versions of a marketing element, such as an email subject line or a landing page, to determine which performs better. This is achieved by randomly dividing your audience into two groups. Group A is exposed to version A, while Group B is exposed to version B.
The key metric you’re trying to improve, whether it’s click-through rate, conversion rate, or another relevant metric, is then measured for each group. The version that performs statistically better according to your predetermined success criteria is declared the winner.
Careful planning is essential for effective A/B testing. Clearly define your hypothesis, choose a representative sample size, and select the appropriate duration for your test. Ensure only one element is varied at a time to isolate its impact. Once a winning variation is identified, implement it across your campaign to maximize results.
Segmenting Data for Deeper Insight
Data segmentation is crucial for refining marketing campaigns. It allows marketers to move beyond broad demographics and target specific customer groups with tailored messages. By dividing your audience into smaller, more homogenous segments, you can significantly improve campaign performance and ROI.
Several methods exist for segmenting data. Demographic segmentation, a common approach, uses characteristics like age, gender, income, and education. Behavioral segmentation focuses on customer actions, such as purchase history, website activity, and product usage. Psychographic segmentation delves into values, interests, and lifestyles, providing a deeper understanding of customer motivations.
Consider using a combination of segmentation methods for a more comprehensive view of your audience. For example, combining demographic data (age) with behavioral data (purchase frequency) allows you to target specific age groups with tailored offers based on their past buying habits.
By leveraging data segmentation, marketers can personalize messaging, optimize channel selection, and ultimately, drive higher conversion rates.
Avoiding Misinterpretation of Data
Misinterpreting data can lead to ineffective or even counterproductive marketing campaigns. Accurate analysis is crucial for making informed decisions. One common pitfall is focusing solely on vanity metrics, such as likes or shares, without considering their impact on actual business objectives. For example, a high number of likes doesn’t necessarily translate to increased sales.
Another mistake is failing to segment data properly. Analyzing aggregate data can obscure important trends within specific customer groups. For instance, a campaign might appear successful overall, but closer examination might reveal that it only resonated with a small segment of the target audience. Therefore, segmenting data by demographics, purchase history, or other relevant factors is essential for identifying which campaigns truly drive results.
Correlation does not equal causation. Observing a relationship between two variables doesn’t necessarily mean one causes the other. For example, noticing an increase in sales during a specific promotion doesn’t automatically prove the promotion caused the increase. External factors might have contributed. Rigorous analysis and, where possible, A/B testing are necessary to establish causal links and accurately measure campaign impact.
Creating Actionable Reports
Generating reports is only the first step. The real value lies in creating reports that are actionable. This means the insights gleaned should directly translate into concrete steps for optimizing your marketing campaigns. An actionable report doesn’t just present data; it provides context and clear direction.
Focus on key performance indicators (KPIs) relevant to your campaign goals. If your goal is to increase brand awareness, track metrics like reach and impressions. If your objective is conversions, focus on click-through rates, conversion rates, and cost per acquisition. Avoid overwhelming your reports with unnecessary data.
Organize your findings logically. Use tables and charts to visualize data and highlight trends. Clearly state the insights derived from the data and recommend specific actions based on those insights. For example, if a report shows a low click-through rate for a particular ad, the recommended action might be to revise the ad copy or targeting parameters.
Regular reporting is crucial for continuous campaign improvement. Establish a reporting schedule and stick to it. This allows you to monitor performance consistently, identify issues promptly, and make necessary adjustments in a timely manner. Remember, the goal is to use data to drive continuous improvement and achieve better marketing outcomes.